


First Quarter 2021 Benchmark Results for Mystery Shops and Resident Surveys Executive Summary
Welcome to 2021! We all faced a truly unprecedented situation in 2020, yet in many ways the COVID-19 pandemic brought out the best in our industry and our people. Thank you for representing the multifamily industry with compassion and empathy and offering a helping hand to others when they needed it most. We are honored to be your business partner. Since 1984, Ellis, Partners in Management Solutions has specialized in helping our customers achieve their business goals. We are pleased to offer a turn-key integrated customer experience program, backed by our outstanding customer service, cutting-edge technology, and longstanding ethical business practices. Our apartment mystery shops, resident surveys, live training, and e-learning partner (Edge2Learn) are resources that can be used independently to address specific needs or jointly for ongoing employee performance optimization. Our goal is to help you achieve yours.
As companies reflect on the many lessons learned in 2020, new ways of navigating customers through the leasing process are being tested, including virtual, guided, and self-guided. Which approach will result in the best customer experience? Which leasing strategy will result in the highest conversion rate? Sales are made and lost based on the overall customer experience. So, what are the barriers to conversion? We believe the answers to these questions and resulting trends can be found within the leasing data. We use data to reveal patterns and trends which help us help you to improve leasing performance. Data patterns help us to identify areas of strength and areas of opportunity. Only clean, unmanipulated, data can provide the evidence we need to help inform better decision-making around industry goals and strategies.
This letter kicks off our 2021 Ellis Benchmark letter series theme, “Barriers to Lease Conversion”, as we turn our focus first to the overarching importance of data integrity.
ELLIS’ FIRST QUARTER 2021 BENCHMARK: OVERALL RESULTS
Mystery Shops
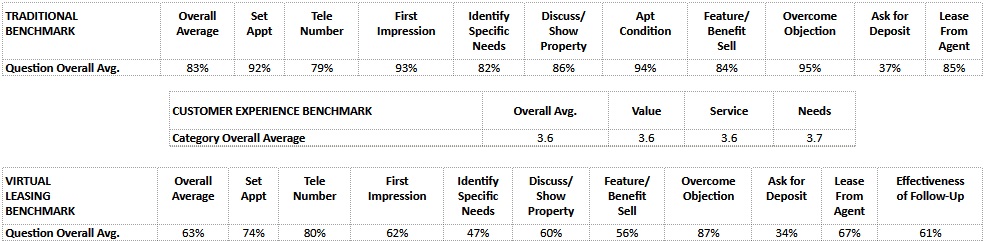
Ellis benchmarks apartment mystery shop performance on the 10 key Benchmark questions and the Customer Experience. Companies can qualify for platinum, gold, silver, or bronze level based on their company’s overall Benchmark score for the quarter.
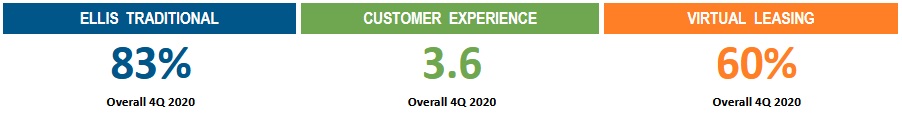
In 2020, the overall average Ellis Traditional Multifamily Industry Benchmark score across Ellis’ entire database of eligible shops1 was 84%, representing 18,645 shops and slightly dipped to 83% for First Quarter 2021, representing 4,093 shops. In response to industry needs during the pandemic and customer demands, we introduced the Ellis Virtual Leasing Benchmark in Q2 2020 based on nearly identical 10 key Benchmark questions. In 2020, we conducted 7,999 virtual shops and the average Ellis Virtual Leasing Benchmark score was 58%. During First Quarter 2021, the average score sharply increased to 63% representing 1,915 virtual shops. These results reflect the continued efforts put in place to drive numbers back up and are a testament to the resilience of our teams. The Ellis Customer Experience Benchmark score remained steady at 3.6 for First Quarter 2021.
As we compare similar questions on Ellis Traditional Multifamily Industry Benchmark to the Ellis Virtual Leasing Benchmark scores, we can see the areas which are more consistent in delivery and areas that can be improved.
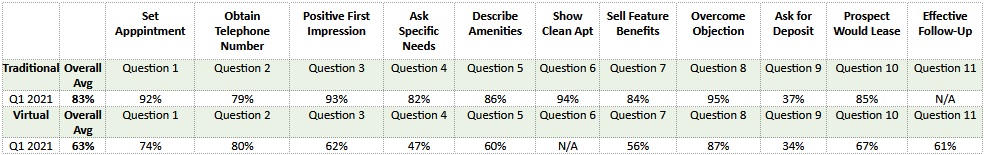
Mystery Shops Overall Average Performance
Resident Surveys
The Ellis Loyalty Benchmark identifies and recognizes the customer experience performance of companies subscribed to the Ellis Resident Surveys Program. It evaluates performance on 5 key touchpoints of the prospect and resident journey. The percentage of surveys responded to by the onsite team and the average number of days it took for the team to respond are also measured because these two factors impact the customer relationship and overall loyalty. Utilizing customer loyalty as a metric allows customer-centric companies the ability to forecast three specific customer behaviors: likelihood to convert/renew, willingness to pay more, and likelihood to recommend.
The overall average Ellis Loyalty Benchmark score in 2020 was 76%, and it increased slightly to 77% for First Quarter 2021. In 2020, the onsite response rate averaged 89% and First Quarter 2021 dropped slightly to 88%. The average response time was 4.8 days in the First Quarter 2021 as compared to 5.3 days in 2020.
Note: Ellis is not publishing Resident Surveys Top Performing Companies for First Quarter 2021.
Resident Surveys Overall Average Performance

Ellis’ customer loyalty score is based on a scale of 0%-100% (see chart below):

ELLIS’ FIRST QUARTER 2021 BENCHMARK: QUESTION/TOUCHPOINT
RESULTS
Mystery Shops
How did we do?
The charts below reflect the average score of Ellis’ entire database for each of the 10 key benchmark questions and the Customer Experience by category, as well as the combined overall Benchmark scores for First Quarter 2021. This data provides a roadmap to success, which in most cases means returning to the basics of sales and customer service.
Resident Surveys
How did we do?
The chart below reflects the average scores across all Ellis Resident Survey companies for each survey touch point for Fourth Quarter 2020, as well as the combined overall loyalty score and average accountability performance results.

 BARRIERS TO LEASE CONVERSION: THE DATA IS SPEAKING. ARE YOU LISTENING?
During the late 70’s and early 80’s, there was an advertising campaign by the brokerage firm E.F. Hutton which always ended every commercial with something like, “Well, my broker is E.F. Hutton, and E.F. Hutton says…” The camera would pan out to show everyone in the room waiting to hear what E.F. Hutton had to say. It was a repetitive and sticky campaign which ended with the slogan: “When E.F. Hutton talks, people listen.” For years, the multifamily industry has mostly listened and looked to the leasing call and the in-person visit documented on the shopping report to evaluate leasing performance. Technology, customer demands, COVID-19, and progress have changed the dynamic of the customer experience evaluation map. No longer does the customer solely evaluate their experience based on their interaction with the leasing professional and the product. With the introduction of a variety of touchpoints, such as customer reviews, websites, virtual leasing, self-guided tours, and more, the customer experience has morphed into a more complex creature with many tentacles. In order to determine how these touchpoints individually and collectively impact the overall “bigger picture” customer experience, we must have a means of tying it all together. Our means is called data.
All data is not created equally. E.F Hutton became a household name because they were considered credible, trustworthy, and of high integrity. Similarly, data integrity is the overall accuracy, completeness, and consistency of your data. Data integrity is the starting point, and clean, unmanipulated data can be analyzed and measured for accurate results. Compromised data is not actionable, and is of little use to an industry, a business, or an individual person. With clean data, we can begin answering many key questions such as:
- Which approach is resulting in the best customer experience?
- Which leasing strategy is resulting in the highest conversion rate?
- How are we using technology?
- Where does the leasing professional fit into the customer experience equation? Do they know and understand their role now?
- What are the barriers to lease conversion?
For many years, barriers to lease conversion mostly centered around the interaction with the leasing professional, experience with the product, marketing materials, and word of mouth advertising. This siloed focus on individual touchpoints misses the bigger picture of the overall customer experience from beginning to end of their journey. Only by looking through the customer’s eyes along the entire journey taken can we truly begin to understand how to meaningfully improve performance and increase lease conversion rates.
“With the advent of the Internet, blogging, social media, and a myriad of digital communication channels, the path to purchase is not a simple straight line, but a complex and varied web of twists and turns – and touchpoints.” Fergal Glynn, VP Marketing, 6 River Systems, Inc.
Clean, unmanipulated data allows us to fairly and accurately contrast the different aspects of the customer experience and provides us with opportunities to remove barriers to lease conversion. Let us consider the various touch points a customer experiences before they actually lease.
How is your customer scheduling their appointment?
What communication channel is the customer utilizing to schedule the appointment? Is it chat, text, web contact form or telephone call? What is the actual conversion ratio from appointment to tour? What does that experience look like? Are there any barriers to conversion that prevent the conversation from moving forward to a tour?
What kinds of tours are available to your customers?
Is it virtual, guided and/or self-guided tours? Do customers prefer one tour type over the other? What do you know about the customer’s touring experience? Which tour type results in more leases? Are there any barriers to moving the conversation toward the lease?
What does follow up look like today?
When are you following up with the customer? How often? What does that messaging looking like? Is it effective enough to keep the customer engaged throughout their journey?
As we consider all these customer touchpoints and what is required to ultimately result in a lease, we need to study the data that is available to us. What does the data tell us? Can we rely on the data, understanding the importance of data integrity? Clean and reliable data is pure – an unmanipulated snapshot of a specific experience at a specific moment in time. The goal for shopping companies, supervisors, and business leaders should be to examine the pure data rather than to dispute or adjust scores. When you believe the information is inaccurate, inappropriate, incorrect, or unclear and warrants further investigation, you should by all means seek resolution. However, it is critical to distinguish gross inaccuracies from the parties’ honest differences in perception. Altering data to meet temporary needs only gives us a false view of performance and can lead us down the wrong path wasting valuable time, energy, and resources. Examination and commitment to data integrity is key.
1. Aligning Your Leasing Team to Customer Goals: Set a Standard and Stick to It.
Your company’s most important asset is data about the experience of your customers, who supply the revenue that makes your business sustainable. Ultimately, delivering the experiences your customers demand comes down to measuring their overall experience journey. No matter the circumstances, every customer contact must be evaluated using the same parameters, the same set of rules. These standards must be applied to every customer experience for the data to be credible and actionable. In a 2018 Forbes article, “Chick-Fil-A is Now McDonald’s Biggest Threat”, there are three great takeaways which also apply to our industry, the customer experience, and the importance of using data to measure and improve success rates.
- To the customer, value is relative. Chick-Fil-A customers do not define value by $1 deals. In comparison, your customers could be willing to pay more for less with the right customer experiences. Define your standards and hold to them. Then use clean data to evaluate, contrast, and take action.
- According to QSR Magazine’s 2018 annual drive-thru study, Chick-Fil-A sat in the 11th spot in speed because unlike McDonald’s they focused on accuracy. I am sure they were not happy to be that far down the list, but their goals were long-term, and they stood by them. How many times have you sped through a McDonald’s drive-thru only to realize that they messed up your order? Chick-Fil-A continuously tested designs and processes within a full-scale model drive-thru at its headquarters in Atlanta, Georgia. In 2020, they moved from the 11th spot to the number one position in speed and accuracy! In order to improve results, you must set the standard, and take the data at face value – good, bad, or ugly. Only then is it actionable.
2. The Data Reveals the Obvious
Sometimes we overlook the obvious with our employees because we are too close to them or the situation. It takes an outside eye to reveal what needs to be changed or improved. Your customers provide invaluable information because while they are all different, their feedback is in response to questions and standards you have set. They do not have any history with the leasing professional, so they are evaluating the experience based on different forms of contact at different moments in time. If the employee comes to work in a bad mood, it could be reflected in the customer comments. If they are short with the customer over the telephone, it could be reflected in the comments. If the customer makes multiple connections with the leasing professional through various channels and there is a disconnect in one location, it could be revealed in the report.
- Relying on the data rather than personal feelings is a protection for direct supervisors who are too close to the employee and situation. Supervisors are not always capable of evaluating the employee’s performance and the customer’s experience that they cannot see first-hand. We all tend to trust what we see, but we do not always have the complete picture. We must hand this evaluation over to the customer and allow them to determine the success or failure of their own experience. At the end of the day, it is their experience. Our opinion or history with the employee should not be a part of the equation. The customer only cares about their experience at a moment in time and what is obvious to them.
3. The Data Reveals Patterns
We use data to reveal patterns and trends which help us to improve our performance and ultimately our business. At the leasing desk, these data patterns help us to identify areas of strength and areas which need more attention. These data trends allow companies to understand whether certain experiences were outliers or more commonplace. If one of the shopping report questions asks the customer, “Would you lease based on your overall experience?”, then it will be easy to determine a pattern of performance or a drop. Sometimes patterns emerge through comments. If they are taken at face value, they can be extremely informative. Let us consider a few patterns that could impact the customer experience and how using clean data can be helpful.
- How long is the average telephone call with a customer for leasing professional A? Is that enough time to convert the call into a lease? What does the data tell you?
- Your requests for in-person tours have increased in the last 30-days, yet your conversion rate has slipped. What is the cause? Is your team prepared for the increase? What is the data telling you?
- Your customers are scheduling appointments but few are showing up. Where is the disconnect? What is your process for confirming appointments and following up? Is your team committed to the appointment process?
- Your walk-in customer traffic doubles after 4:00 pm on Tuesdays. What is causing the increase?
Data reveals patterns. This data can come from a shopping report, resident survey, review site, or a sudden noticeable change in typical customer or employee patterns. Patterns are all around us.
Clean data provides the evidence we need to help inform better decision-making around company goals and strategies. Data provides a snapshot of the entire journey and confirms that marketing messages are reflected accurately and consistently in the presentation. If the data is unmanipulated, companies are better able to mitigate any obstacles on the customer experience journey and increase business efficiencies. Trust the customer to reveal their story to you. Eliminate the risk or temptation to corrupt the data for short-term goals. As the customer touchpoints continue to expand, we must have a consistent and reliable means of determining how these touchpoints individually and collectively impact the overall “bigger picture” customer experience.
When the data speaks, will you listen?
Thank you for your ongoing support, participation, and feedback, which help make this report informative, fresh, and a reliable resource. We hope you will find Ellis Partners in Management Solutions to be not only the finest source for apartment mystery shopping and resident surveys but also a training resource (including our partner (Edge2Learn) for your organization. Additional support and information can be found on our website. Also, Edge2Learn’s free multifamily training resource library includes several leasing training resources for you and your teams.
April 30, 2021
Prepared by Joanna Ellis, Chief Executive Officer and Francis Chow, Chief Strategic Officer