


Fourth Quarter 2024 Benchmark Results for Mystery Shops and Resident Surveys
Executive Summary
Thank you for your continued support of Ellis, Edge2Learn, and Grace Hill. We have been fortunate to have the support of your teams and to be able to provide this Quarterly Benchmark Letter and Industry Performance Metrics for over two decades.
In addition, you can find consolidated mystery shopping and survey performance analyses and insights in our new monthly LinkedIn newsletter, What Matters This Month. Subscribe to our LinkedIn newsletter here to stay informed and join our community.
We greatly appreciate your partnership and look forward to sharing more valuable insights with you.
Overall Results
Mystery Shops
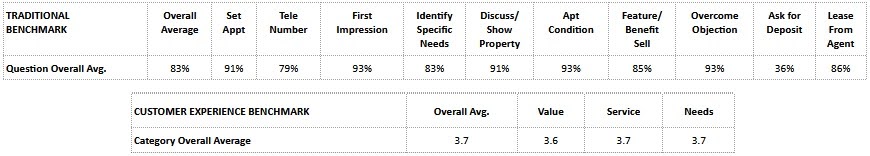
We benchmark apartment mystery shop performance against the 10 key benchmark questions and the Customer Experience for telephone and onsite presentations.
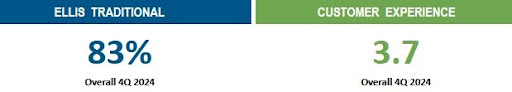
For 2023, the average Ellis Traditional Multifamily Industry Benchmark score across Ellis’ entire database of eligible shops was 82%. Ellis Traditional Multifamily Industry Benchmark performance for Fourth Quarter 2024 is 83%. In 2023, the average Ellis Customer Experience Benchmark was 3.7. Ellis Customer Experience Benchmark performance for Fourth Quarter 2024 is 3.7.
Mystery Shops Overall Performance
CONGRATULATIONS TO ELLIS BENCHMARK TOP PERFORMING MYSTERY SHOPPING COMPANIES Fourth Quarter 2024
Ellis wishes to congratulate the companies below for their Ellis Shopping Benchmark performance for Fourth Quarter 2024.
*Companies are listed in alphabetical order
| Tier 1 (70 or more completed shops) | Tier 2 (30 – 69 completed shops) |
| Ellis Traditional Benchmark Platinum Level Achievers – IMT Residential | |
| Ellis Customer Experience Benchmark Gold Level Achievers** – American Landmark – Gallery Residential – Greystar Management Services – Willow Bridge | Ellis Customer Experience Benchmark Gold Level Achievers ** – Hanover RS Limited Partnership – IMT Residential – Kairoi Residential – Morgan Group – TA Realty |
*Companies are listed in alphabetical order.
Resident Surveys
The Ellis Loyalty Benchmark identifies and recognizes the customer experience performance of companies subscribed to the Ellis Resident Surveys Program. It evaluates performance on five key touchpoints of the prospect and resident journey. The percentage of surveys onsite teams responded to and the average number of days it takes for the team to respond are also measured because these two factors impact the customer relationship and overall loyalty. Utilizing customer loyalty as a metric allows customer-centric companies the ability to forecast three specific customer behaviors: likelihood to convert/renew, willingness to pay more, and likelihood to recommend.
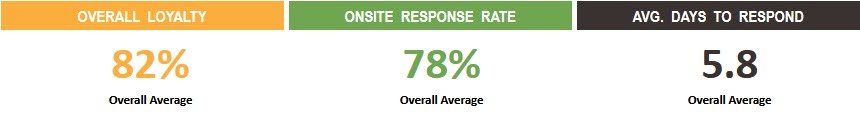
The overall average Ellis Loyalty Benchmark score in 2023 was 80%. The Ellis Loyalty Benchmark for Fourth Quarter 2024 is 82%. In 2023, the onsite response rate averaged 82% and is 78% for Fourth Quarter 2024. The average response time in 2023 was 5.7 days; in Fourth Quarter 2024, it was 5.8.
Resident Surveys Overall Average Performance
The customer loyalty score is based on a scale of 0%-100% (see chart below):

Ellis Benchmark Top Performing Resident Surveys by Company – Fourth Quarter 2024
Ellis wishes to congratulate the companies below for their Ellis Surveys Benchmark performance for Fourth Quarter 2024.
*Companies are listed in alphabetical order
| Ellis Best in Class Achievers Tier 1 (1,600 or more units) | Ellis Best in Class Achievers Tier 2 (1,599 or fewer units) |
| – Asset Living – Avanti Residential – Cathcart Property Management – Fore Property Company – Friedman Realty Group – Guardian Management, LLC – Mack Property Management – Manco Abbott – Olympus Property – Quarterra – ResideBPG – Russo Property Management – Simpson Property Group – Steadfast Management – Willow Bridge – Woodmont Properties – Zaremba Management Company | – Ghertner & Company – HRI Management LLC – O’Brien Realty Group – Samuels & Associates – StarPoint Properties, LLC – Sunrise Management & Consulting – TM Realty Services |
*Companies are listed in alphabetical order.
Question/Touchpoint Results: How Did We Do?
Mystery Shops
The charts below reflect the average score of Ellis’ entire database for each of the 10 key benchmark questions for telephone/onsite shops for Fourth Quarter 2024, as well as the Customer Experience for telephone/onsite shops by category for this quarter.
Resident Surveys
The chart below reflects the average scores across all Ellis Resident Survey companies for each survey touchpoint for Fourth Quarter 2024, as well as the combined overall loyalty score and average accountability performance results.

We thank you again for your support, participation, and feedback, which help make this report informative, fresh, and reliable. We hope you find Grace Hill to be not only the finest source for apartment mystery shopping and resident surveys but also a training resource for your organization. For additional support and information, visit Ellis – A Grace Hill Company, Grace Hill.
Prepared by Lisa Ford, Director Mystery Shopping Services

Ellis – A Grace Hill Company (EPMS)
4545 Fuller Drive | Suite 406
Irving, TX 75038
888.988.3767 telephone
[email protected]
www.epmsonline.com | www.gracehill.com
Footnotes: 1 See website for Mystery Shop Benchmark and Resident Surveys Benchmark eligibility, tier level, and recognition requirements for apartment mystery shops and resident surveys.