


Fourth Quarter 2023 Benchmark Results for Mystery Shops and Resident Surveys
Executive Summary
Welcome to the final installment of our 2023 Benchmark letter series. Our industry survived 2023’s uncertain market conditions, where we saw minor recovery by year-end in areas including supply chain challenges and interest rate hikes, but are still contending with negative rent growth that’s been plaguing us for the latter part of the year. This year we will see one of the largest increases in new apartment development, according to GlobeStreet – another 670,000 new apartment homes are under development. With competition getting stronger, and greater in number, we must set ourselves apart early in the customer’s journey to find a new home and drive first contacts to in-person visits and lease conversions.
As part of Grace Hill, the Ellis and Edge2Learn teams remain focused on product and service integrations, including presenting quarterly benchmarking across both the Ellis and Grace Hill full suite of products. This quarter’s article focuses on Ellis Shops and Surveys data for Fourth Quarter 2023.
Overall Results
Mystery Shops
Ellis benchmarks apartment mystery shop performance against the 10 key benchmark questions and the customer experience for telephone and onsite presentations. Companies can qualify for platinum, gold, silver, or bronze levels based on their overall benchmark scores for the quarter.
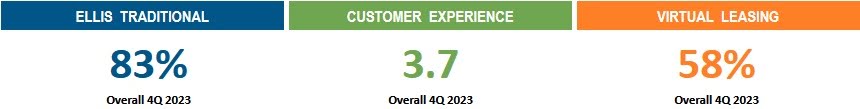
In 2022, the average Ellis Traditional Multifamily Industry Benchmark score across Ellis’ entire database of eligible shops was 83%. Third Quarter 2023 was slightly lower at 82%, but edged back up to 83% for Fourth Quarter 2023. In response to industry needs during the pandemic and customer demands, we introduced the Ellis Virtual Leasing Multifamily Industry Benchmark in Second Quarter 2020 based on the nearly identical 10 key benchmark questions. In 2022, the average Ellis Virtual Leasing Multifamily Industry Benchmark score was 65%. The average had dropped significantly as of Third Quarter 2023 to 49%, and rose sharply to 58%, still falling short of prior year performance. This could be due to less focus on virtual shopping post-Pandemic. The Ellis Customer Experience Benchmark remained relatively steady at 3.7 for Fourth Quarter 2023, compared to 3.6 in Third Quarter 2023.
Ellis Benchmark Top Performing Mystery Shops by Company – Fourth Quarter 2023
Ellis wishes to congratulate the companies below for their Ellis Shopping Benchmark performance for Fourth Quarter 2023.
*Companies are listed in alphabetical order
| Tier 1 (70 or more completed shops) | Tier 2 (30 – 69 completed shops) |
| Ellis Traditional Benchmark Platinum Level Achievers – IMT Residential | |
| Ellis Customer Experience Benchmark Gold Level Achievers** – Bozzuto & Associates – Wood Partners | Ellis Customer Experience Benchmark Gold Level Achievers ** – Continental Properties – IMT Residential – Richland Property Services, Inc. – TA Realty |
Resident Surveys
The Ellis Loyalty Benchmark identifies and recognizes the customer experience performance of companies subscribed to the Ellis Resident Surveys Program. It evaluates performance on five key touchpoints of the prospect and resident journey. The percentage of surveys responded to by the onsite team and the average number of days it took for the team to respond are also measured because these two factors impact the customer relationship and overall loyalty. Utilizing customer loyalty as a metric allows customer-centric companies to forecast three specific customer behaviors: likelihood to convert/renew, willingness to pay more, and likelihood to recommend.
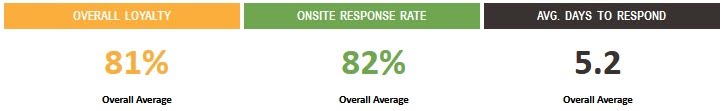
The overall average Ellis Loyalty Benchmark score in 2022 was 78%. Third Quarter 2023 reflected marginal improvement to 80% and has climbed slightly to 81% for Fourth Quarter 2023. In 2022, the onsite response rate averaged 86%, dropping to 82% in Third Quarter 2023 and remaining steady at 82% during Fourth Quarter 2023. The average response time in 2022 was 5.6 days, falling to 5.8 days in Third Quarter 2023 but improving significantly to 5.2 days in Fourth Quarter 2023. While onsite teams are responding quicker to surveys, they are responding to fewer. Given the competitive environment for 2024, it is imperative that onsite teams respond to all surveys, even positive ones, to better engage with residents.
The overall average Ellis Loyalty Benchmark score in 2022 was 78%. Second Quarter 2023 reflected a slight uptick to 80% and remained unchanged at 80% for Third Quarter 2023. In 2022, the onsite response rate averaged 86%, dropping to 81% in Second Quarter 2023 and regaining slightly to 82% during Third Quarter 2023. The average response time in 2022 was 5.6 days, improving to 5.3 days in Second Quarter 2023 but declining significantly to 5.8 days in Third Quarter 2023.
Ellis’ customer loyalty score is based on a scale of 0%-100% (see chart below):

Ellis Benchmark Top Performing Resident Surveys by Company – Fourth Quarter 2023
Ellis wishes to congratulate the companies below for their Ellis Surveys Benchmark performance for Fourth Quarter 2023.
*Companies are listed in alphabetical order
| Ellis Best in Class Achievers Tier 1 (1,600 or more units) | Ellis Best in Class Achievers Tier 2 (1,599 or fewer units) |
| – Avanti Residential – Cathcart Property Management – F and F Realty – Fore Property Company – Friedman Realty Group – Guardian Management, LLC – Manco Abbott – Olympus Property – Pinnacle (PRMC) – Quarterra – ResideBPG – Russo Property Management – Simpson Property Group – Sparrow Partners – Steadfast Management – Willow Bridge – Woodmont Properties – Zaremba Management Company | – Evolve Management Group, LLC – Ghertner & Company – Longboat Enterprises – Samuels & Associates – Southern Land Company – StarPoint Properties – Sunrise Management & Consulting – TM Realty Services – United Financial Group, Inc |
Question/Touchpoint Results: How Did We Do?
Mystery Shops
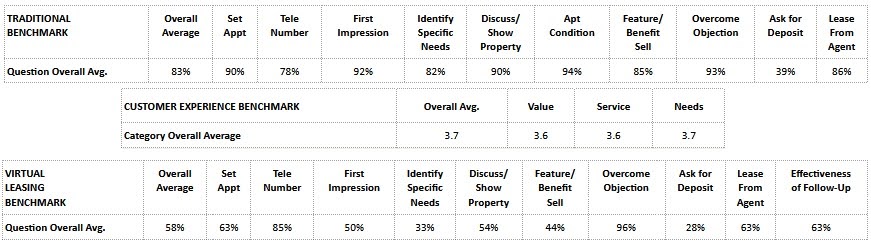
The charts below reflect the average score of Ellis’ entire database for each of the ten key benchmark questions for telephone/onsite and virtual leasing shops for Fourth Quarter 2023, as well as the customer experience for telephone/onsite shops by category for this quarter.
Resident Surveys
The chart below reflects the average scores across all Ellis Resident Survey companies for each survey touch point for Fourth Quarter 2023, as well as the combined overall loyalty score and average accountability performance results.

THE IMPACT OF CALLS AND ONSITE INQUIRIES ON THE CUSTOMER EXPERIENCE
The 2020 Census revealed that one-third of all single-family residences were rental properties; by the end of 2023 that number had grown closer to 35%. Zillow reports multifamily homes have experienced a 23.3% growth in rents since the onset of the pandemic, but rent growth slowed significantly for 2023, reflecting a mere 3.3% increase compared to the previous year. As the cost of living continues to rise, and we cannot rely on rent growth alone to sustain and increase our NOI, where do we turn? One thing is certain: We must respond quickly and efficiently to all leads so that none fall to the competition by default. Once we have their attention, the next challenge is how to keep it.
In today’s digital age, many people prefer searching for apartments online. Websites and apps provide detailed information, photos, virtual tours, and even reviews, making it convenient for potential renters to explore options from the comfort of their homes. While some renters, especially those relocating from afar, take a leap of faith and lease apartments without touring, most still prioritize an in-person tour to get a tangible feel for the space and neighborhood. Either way, your best chance at securing a new sale is to hone your phone, email, and in person sales skills.
Making the Most of Your Digital Presence
Many individuals lead busy lives balancing work, social activities, and other commitments during regular business hours. As a result, they often turn to apartment search platforms, websites, and apps during evenings and weekends to explore their options. The effectiveness and speed of the first response to the initial contact plays a crucial role in driving engagement.
Across a sampling of 5,000 recent internet shops, a shocking 29% of leads did not get a response at all. Of those shops where a response was received, 49% expressed interest in visiting or leasing when they heard back within one business hour, with 71% of those decisions being influenced by having all of their questions answered by the leasing team’s response. Desire to visit the community drastically declined to 17% when the response time hit between one and two business hours, even if all their questions were answered. Customers not only value their own time, but they expect us to demonstrate that we value their time as well.
And customers’ expectations of us are often set well before we are aware of their interest. Here are a few things to keep in mind regarding your digital presence.
- Stay Active on Social Media: Actively engage on social media platforms. Share updates, respond to comments, and use visuals to showcase the community’s lifestyle.
- Encourage and Respond to Online Reviews: Encourage satisfied residents to leave positive reviews on platforms like Google, Yelp, or apartment-specific sites. Responding to reviews, both positive and negative, shows you are engaged with your residents and invested in their happiness.
- Enhance Visuals and Virtual Tours: Offer virtual tours or 3D walkthroughs to give potential renters a detailed view of your apartments. Employ maps and QR codes to create more user engagement and time spent on your website.
- Optimize Your Website: Ensure your community has a user-friendly and informative website. Include high-quality photos (including of your onsite team), detailed floor plans, and contact information. Your business hours should be clearly shown and accurate.
- Invest in Digital Advertising: Targeted digital advertising on platforms like Google Ads or social media can help you reach your desired audience.
Taking Your Sales Calls to the Next Level
It’s important to prioritize clear communication and efficient information exchange on leasing calls to convert callers into renters. Here are some key areas to emphasize:
- Contact Information and Preferences/Desires in a Home: Ensure you have contact information so you can personalize the conversation and initiate follow-up questions. Be sure to seek out and clarify the caller’s preferences, likes (or dislikes), and why they are making a change from where they currently live.
- Unit, Community, and Neighborhood Amenities: Share details on amenities, policies, and any additional perks that set you apart.
- Availability and Pricing: Give accurate information on available units, lease terms, and pricing.
- Application Process: Help callers understand the application process, required documents, and potential fees. If they are apt to lease sight unseen, get them to the application!
- Specials or Discounts: Save concessions for the right time during the conversation. If you can feel an objection to the rental rate, find ways to sell value in your offerings before jumping to a current promotion, move-in special, or discount. But you have these tools if needed so don’t let the prospect get away if you can nurture their interest with the right incentive.
- Scheduling a Visit: If interested, schedule a convenient time to tour the apartment in person.
A successful apartment leasing call isn’t just about gathering and providing a checklist (or laundry list) of information. The call should be long enough to address all relevant questions and concerns while keeping the conversation engaging. The length of calls will vary depending on the complexity of the information and level of interest from the prospective renter. You should be listening to cues that the prospect is gaining more interest or that perhaps they are reaching the point where they’re ready to close the call.
Across a sampling of 17,000 recent shops, the average call length was just over 4 minutes. Of those shops, the average length of call where the prospect was interested in visiting or leasing was approximately one minute longer. We can infer from this data that it is not necessarily how long you keep the prospect on the phone that determines the success of the call, but rather just how impactful that one minute can be to the customer’s experience and overall perception of the interaction.
It’s crucial to strike a balance; you don’t want to rush through influential details, but you also want to respect the potential renter’s time. Flexibility in your presentation is key! One size does not fit all. Some calls may be shorter, while others may take longer if the prospective renter has more detailed questions. In the same data sampling, there were strong correlations between the desire to visit or apply and discovering the caller’s wants, preferences, and likes (93%), and personalizing descriptions of the home and community to the caller’s interests (95%).
Building a Better Omnichannel Experience
Chances are your customer isn’t only researching a new home by one method. Prospects increasingly engage with us using multiple channels. This presents us with more opportunities and more challenges. Creating a seamless omnichannel experience requires a consistent approach regardless of whether the customer shops online (i.e., your website or a social media platform) – or visits your location in person.. CMS Wire elaborates on a successful omnichannel experience as one that provides:
- Consistency: Customers should have a consistent experience across all channels, regardless of which channel they choose to interact with a company. When was your website last updated? Are floor plans and pricing up to date? Have you added or changed any services or amenities?
- Personalization: Customers should be able to personalize their interactions with a company, and the company should be able to personalize its interactions with customers. Does your contact form allow for the expression of feature, location, lifestyle interests? Does it allow the customer to provide a preferred method and timing for your response?
- Relevance: The company should provide customers with relevant content and offers in person and online. Does pricing online update based on move dates, feature and location preferences, etc.?
- Engagement: The company should engage with customers in a way that is meaningful and relevant to them. There is no need to sell a prospect on a feature that’s not important to them, and in fact doing so can damage your chances at getting the lease. But, in order to know what advantages matter to the prospect, it is your job to seek out ways to understand what the customer may not think to readily volunteer.
Remember, the primary goal of responding to that online inquiry or conducting a telephone conversation is to leave the caller well-informed and interested in moving forward – whether that’s an in person visit to your community or signing the lease online.
We thank you for your ongoing support, participation, and feedback, which helped make this report an informative, fresh, and reliable resource. We hope you find Ellis | Grace Hill to be not only the finest source for apartment mystery shopping and resident surveys but also a training resource for your organization. Additional support and information can be found on our websites: Ellis – A Grace Hill Company, Grace Hill, and Edge2Learn.
February 2, 2024

Prepared by Lisa Ford, Director Mystery Shopping Services
Ellis – A Grace Hill Company (EPMS)
4545 Fuller Drive | Suite 406
Irving, TX 75038
888.988.3767 telephone
[email protected] | [email protected]
www.epmsonline.com | www.gracehill.com